Introduction to Gantt Chart

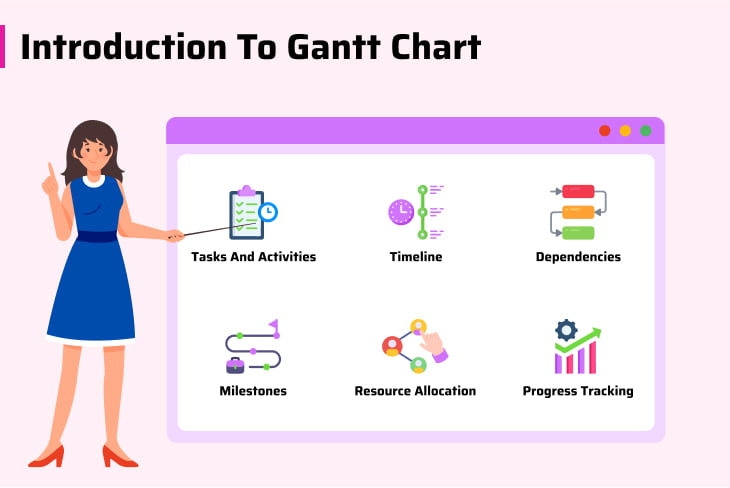
Here’s an introduction to its key components:
- Tasks and Activities: These are represented as horizontal bars along a timeline. Each task is listed on the left-hand side, and its corresponding bar extends across the chart to represent its duration.
- Timeline: The timeline, typically displayed along the horizontal axis of the chart, represents the project’s timeframe. It could be days, weeks, months, or even years, depending on the scale of the project.
- Dependencies: The Gantt chart allows you to establish dependencies between tasks, indicating which tasks must be completed before others can begin. Dependencies help in understanding the sequence of tasks and identifying potential bottlenecks.
- Milestones: Important events or checkpoints within the project are often highlighted as milestones on the chart. Milestones typically represent significant achievements or the completion of key deliverables.
- Resource Allocation: Some advanced software allows you to assign resources (such as team members or equipment) to specific tasks, helping you to manage resource allocation effectively.
- Progress Tracking: It also facilitates progress tracking by allowing you to compare planned vs. actual timelines. As tasks are completed, the corresponding bars are filled in or shaded to indicate progress.
Use of Gantt Chart and Benefits
- Visual Clarity: Project deadlines, tasks, and dependencies are visually represented in Gantt view charts understandably and straightforwardly. Project managers and team members can easily grasp the project’s scope, timetable, and progress at a look because of the visual clarity.
- Task Sequencing and Dependencies: Project managers can arrange tasks and determine dependencies between them using Gantt. Teams may more efficiently allocate resources and comprehend the sequence in which activities must be accomplished by visualizing task dependencies.
- Resource Allocation: Furthermore, project managers may more effectively manage their resources by using Gantt to assign tasks to team members and monitor their availability and workload. By doing this, resource disputes may be avoided and team members’ work can be divided equally.
- Timeline Management: By establishing proper start and finish dates for each activity, Gantt view charts assist project managers in efficiently managing project timeframes. Thus, project managers can prevent delays or bottlenecks and keep the project moving forward by visualizing task durations and deadlines.
- Progress Tracking: By enabling team members to adjust task statuses, completion percentages, and actual start and finish dates, a Gantt chart enables real-time tracking of project progress. This gives project managers the ability to track development, spot delays or plan deviations, and make quick modifications to maintain the project’s timeline.
- Communication and Collaboration: Gantt functions as a tool for communication that encourages cooperation and coordination amongst project participants. Thus, project managers may make sure that everyone is aware of the timetables, milestones, and responsibilities of their projects by providing Gantt view charts to team members, clients, and other stakeholders.
- Risk Management: Through the visualization of important routes, dependencies, and possible bottlenecks, Gantt assists project managers in identifying and mitigating project risks.
Conclusion
The Gantt view chart is crucial for project management, providing several advantages that improve productivity and structure. Project managers may successfully plan, monitor, and alter project schedules with the use of it. Thus, it provides a visual depiction of project timeframes, tasks, dependencies, and progress.
Gantt chart ensures that all parties involved in the project have a common knowledge of the goals and schedules by facilitating clear communication between team members, stakeholders, and clients.
Furthermore, it also aids in risk management, resource allocation, and bottleneck identification by emphasizing important routes and potential delays. All things considered, the Gantt view chart is a fundamental component of project management that enables teams to effectively complete tasks on schedule and within budget.
Frequently asked questions
Can I do a Gantt chart in Excel?
What is the Gantt chart used for?
How to make a Gantt chart in Excel?
- List all the tasks or activities required for your project in one column.
- Create additional columns for start date, end date, duration, and other relevant information.
- Insert a stacked bar chart in Excel.
- Input your data into the chart, using the start and end dates to define the duration of each task.
- Format the chart to represent your project timeline accurately, including adjusting colors, adding labels, and configuring axis scales.
- Optionally, add conditional formatting to highlight critical tasks or milestones.
What is a Gantt chart?
What four items are shown on a Gantt chart?
- Tasks or activities: A list of all the tasks required to complete the project.
- Timeline: A horizontal axis representing the project timeline, usually in days, weeks, or months.
- Bars: Horizontal bars representing the duration of each task, with the beginning and end dates.
- Dependencies: Relationships between tasks, often indicated by connecting lines or arrows to show which tasks must be completed before others can begin.

